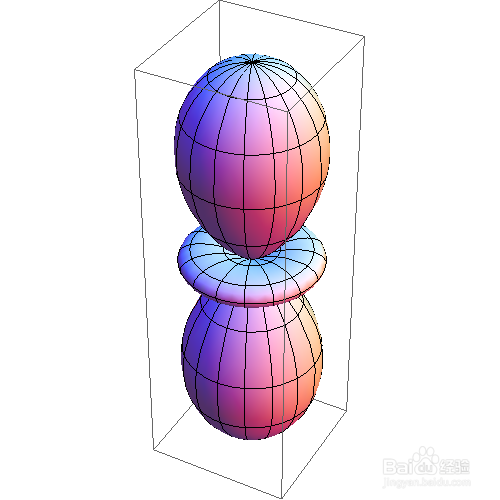
1、 球坐标的绘图,用SphericalPlot3D。
举个例子:
SphericalPlot3D[ 1 + 2 Cos[2 \[Theta]], {\[Theta], 0, Pi}, {\[Phi], 0, 2 Pi}]

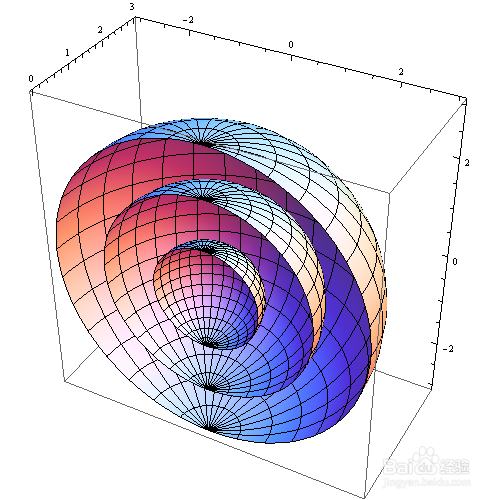
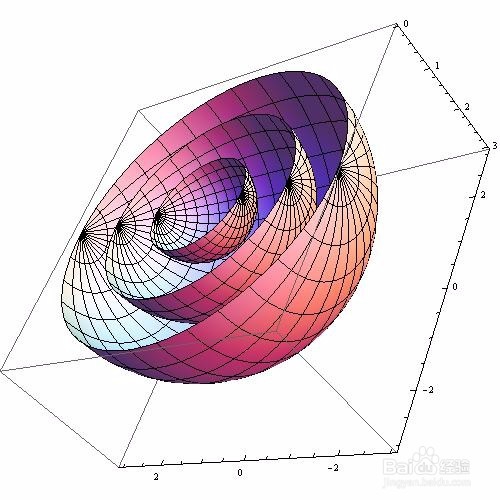
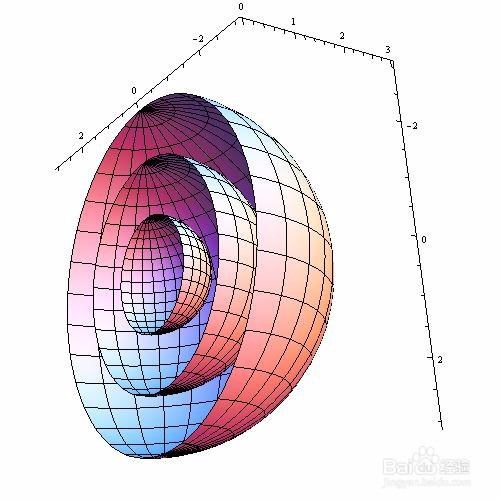
2、 画三个同心半球:
SphericalPlot3D[{1, 2, 3}, {\[Theta], 0, Pi}, {\[Phi], 0, Pi}, PlotPoints -> 30]
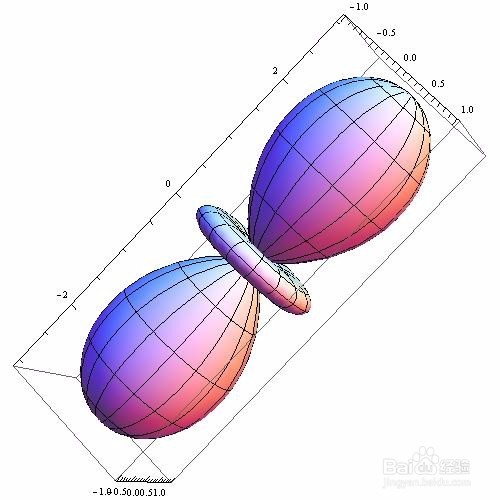
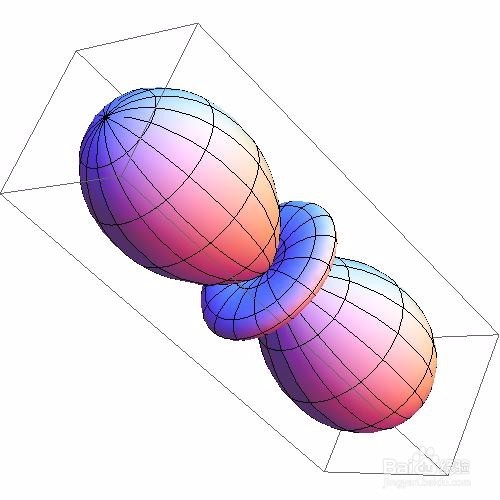
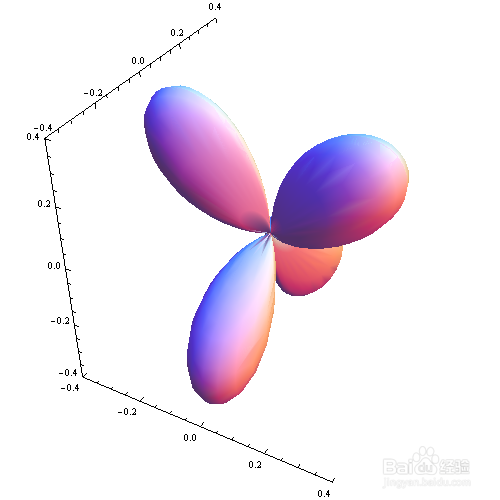
3、 再举一例,这次涉及到复变函数:
SphericalPlot3D[
Re[Sin[\[Theta]] Cos[\[Theta]] Exp[2 I*\[CurlyPhi]]], {\[Theta],
0, \[Pi]}, {\[CurlyPhi], 0, 2 \[Pi]}]


4、 绘图时,去掉坐标轴:
SphericalPlot3D[ 1 + 2 Cos[2 \[Theta]], {\[Theta], 0, Pi}, {\[Phi], 0, 2 Pi}, Axes -> False]
5、 绘图时,去掉外框:
SphericalPlot3D[{1, 2, 3}, {\[Theta], 0, Pi}, {\[Phi], 0, Pi},
PlotPoints -> 30, Boxed -> False]

6、 绘图时,去掉网格线:
SphericalPlot3D[
Re[Sin[\[Theta]] Cos[\[Theta]] Exp[2 I*\[CurlyPhi]]], {\[Theta],
0, \[Pi]}, {\[CurlyPhi], 0, 2 \[Pi]}, Mesh -> None]

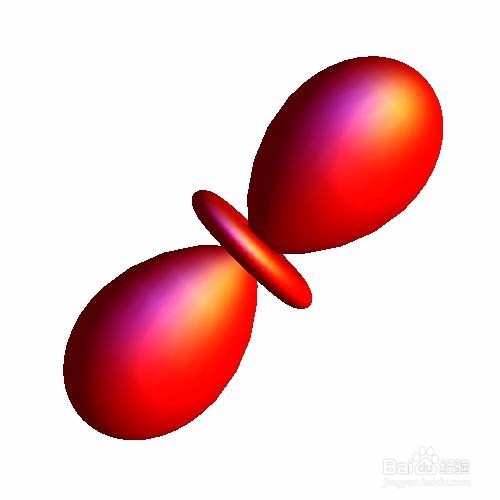
7、 红色,不透明,高光:
SphericalPlot3D[
1 + 2 Cos[2 \[Theta]], {\[Theta], 0, Pi}, {\[Phi], 0, 2 Pi},
PlotStyle -> Directive[Red, Opacity[1], Specularity[White, 10]],
Mesh -> None, PlotPoints -> 30, Axes -> False, Boxed -> False]
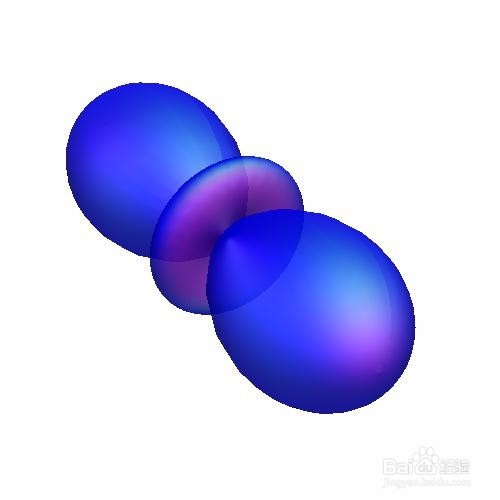
蓝色,半透明,高光:
SphericalPlot3D[
1 + 2 Cos[2 \[Theta]], {\[Theta], 0, Pi}, {\[Phi], 0, 2 Pi},
PlotStyle -> Directive[Blue, Opacity[0.7], Specularity[White, 6]],
Mesh -> None, PlotPoints -> 30, Axes -> False, Boxed -> False]
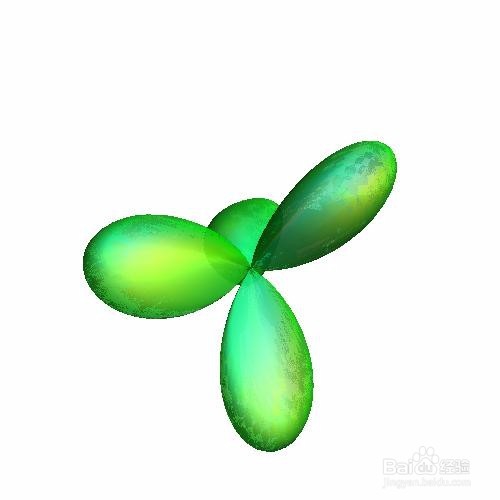
8、 绿色的半透明“仙人掌”:
SphericalPlot3D[
Re[Sin[\[Theta]] Cos[\[Theta]] Exp[2 I*\[CurlyPhi]]], {\[Theta], 0,
Pi}, {\[CurlyPhi], 0, 2 Pi},
PlotStyle -> Directive[Green, Opacity[0.5], Specularity[White, 6]],
Mesh -> None, PlotPoints -> 30, Axes -> False, Boxed -> False]

9、 五个楞的“什么瓜”:
SphericalPlot3D[
1 + Sin[5 \[Phi]]/5, {\[Theta], 0, Pi}, {\[Phi], 0, 2 Pi},
PlotStyle -> Directive[Green, Opacity[0.5], Specularity[White, 10]],
Mesh -> None, PlotPoints -> 30, Axes -> False, Boxed -> False]


10、 色彩渐变:
SphericalPlot3D[
Re[Sin[\[Theta]] Cos[\[Theta]] Exp[2 I*\[CurlyPhi]]], {\[Theta], 0,
Pi}, {\[CurlyPhi], 0, 2 Pi},
ColorFunction -> (ColorData["Rainbow"][#6] &), Mesh -> None,
PlotPoints -> 25, Boxed -> False, Axes -> False]
和
SphericalPlot3D[
1 + Sin[5 \[Phi]]/5, {\[Theta], 0, Pi}, {\[Phi], 0, 2 Pi},
ColorFunction -> (ColorData["Rainbow"][#6] &), Mesh -> None,
PlotPoints -> 25, Boxed -> False, Axes -> False]